How subcontractors can use data to improve hit-ratio
Written by Andy Lee
Today we'll discuss how subcontractors can develop a data-driven approach to bidding and break down the math of how even small changes in hit-ratio dramatically affect a subcontractor's bottom-line. Specifically, we'll cover 3 topics
- Why hit-ratio directly impacts profit and loss
- Short-term, how to use hit-ratio to increase profit without adding costs
- Long-term, how to use multiple hit-ratios to forecast and create a growth strategy
Definition
Hit ratio is defined to be

In layman's terms, bid hit-ratio measures how effective you are at winning bids.
The math of how hit-ratio affects profit
Hit ratio measures efficiency. If your hit-ratio is high, then you don't need many bids or estimators to hit-revenue targets. If your hit-ratio is low, then you need many bids and many estimators to hit revenue targets. To see this, let's consider two estimating teams: Team Red, Team Blue with hit-ratio 10% and 15% respectively. Also assume an estimator can bid 10 projects a month.
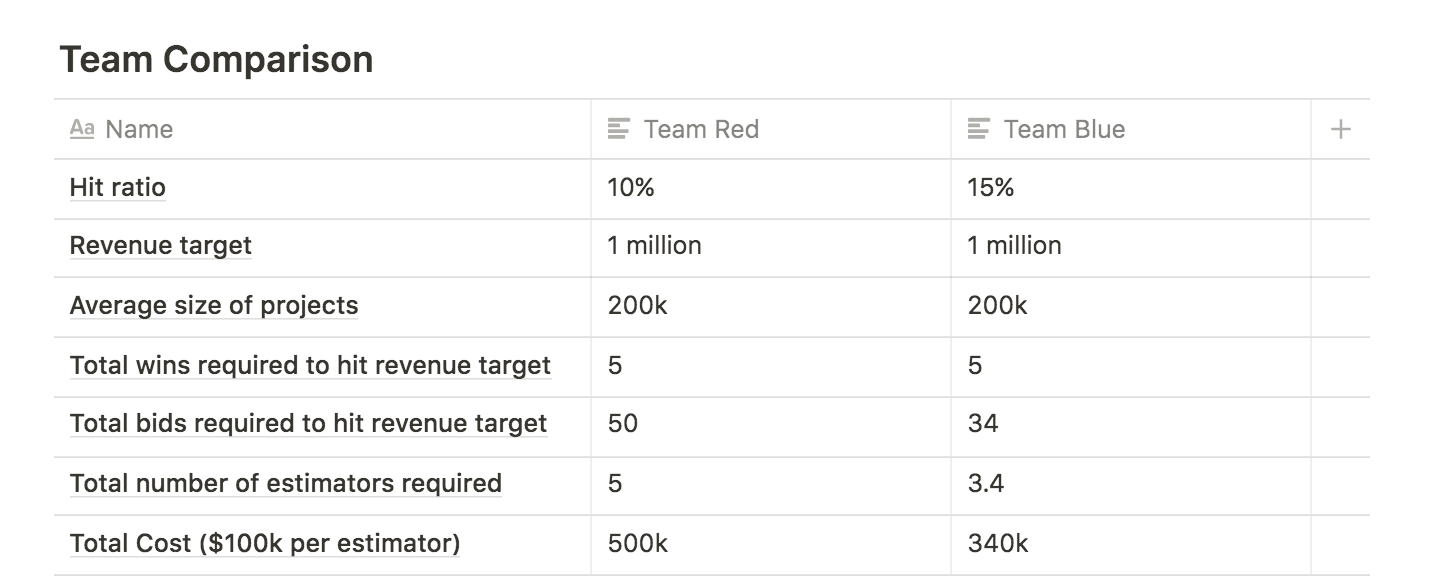
From this example, we can see how just a 5% increase in hit-ratio dramatically reduces the number of wins required to reach the 1 million revenue target (from 50 to 34).
The impact is that we need fewer estimators to reach the same revenue target and that there's an immediate profit of 160k. The takeaway is not that increasing hit-ratios is good; that's obvious. The takeaway is that even a single digit increase in hit-ratio can have an enormous impact on profit and overhead and it's this magnitude of impact that drives the best estimating teams to be obsessive about hit-ratio.
Insight 1: Use data to find your niche
One immediate action subcontractors can take to increase profit is to rigorously analyze their bidding data to understand which types of bids yield the highest hit-ratios. We work with estimating teams across the country and every single one of our enterprise customers (i.e. subcontractors with 100m+ revenue) have bid boards that track factors like
- Project name
- GCs bidding
- market-sector
- relevant trades
- bid amount
- margin
In fact, the common thread among most advanced contractors is that they are all very disciplined around tracking projects and analyzing bidding data.
If you're not already tracking hit-ratios, start by asking these 4 questions.
- What types of bids are my hit-ratios the highest?
- Which GCs have resulted in the highest hit-ratio for? Why?
- Which market-sectors have resulted in the highest hit-ratio? Why?
- Which estimators have resulted in the highest hit-ratio? Why?
By diving into your bidding data, you'll see your highest performing niches. More importantly, you'll start to explore questions that expose opportunities (and blindspots) in your estimating process
- Why are certain numbers low?
- What margins typically result in wins?
- Do budgets actually result in more bids and more wins?
- Does this GC award you work compared to your other GCs?
Most subcontractors have a gut-feel for these questions, but the best subcontractors are disciplined about using actual data to dive deep and find opportunities to improve. This is also why the best contractors develop a habit of consistently generating reports that help summarize and visualize data in a way that helps inform bidding strategy.
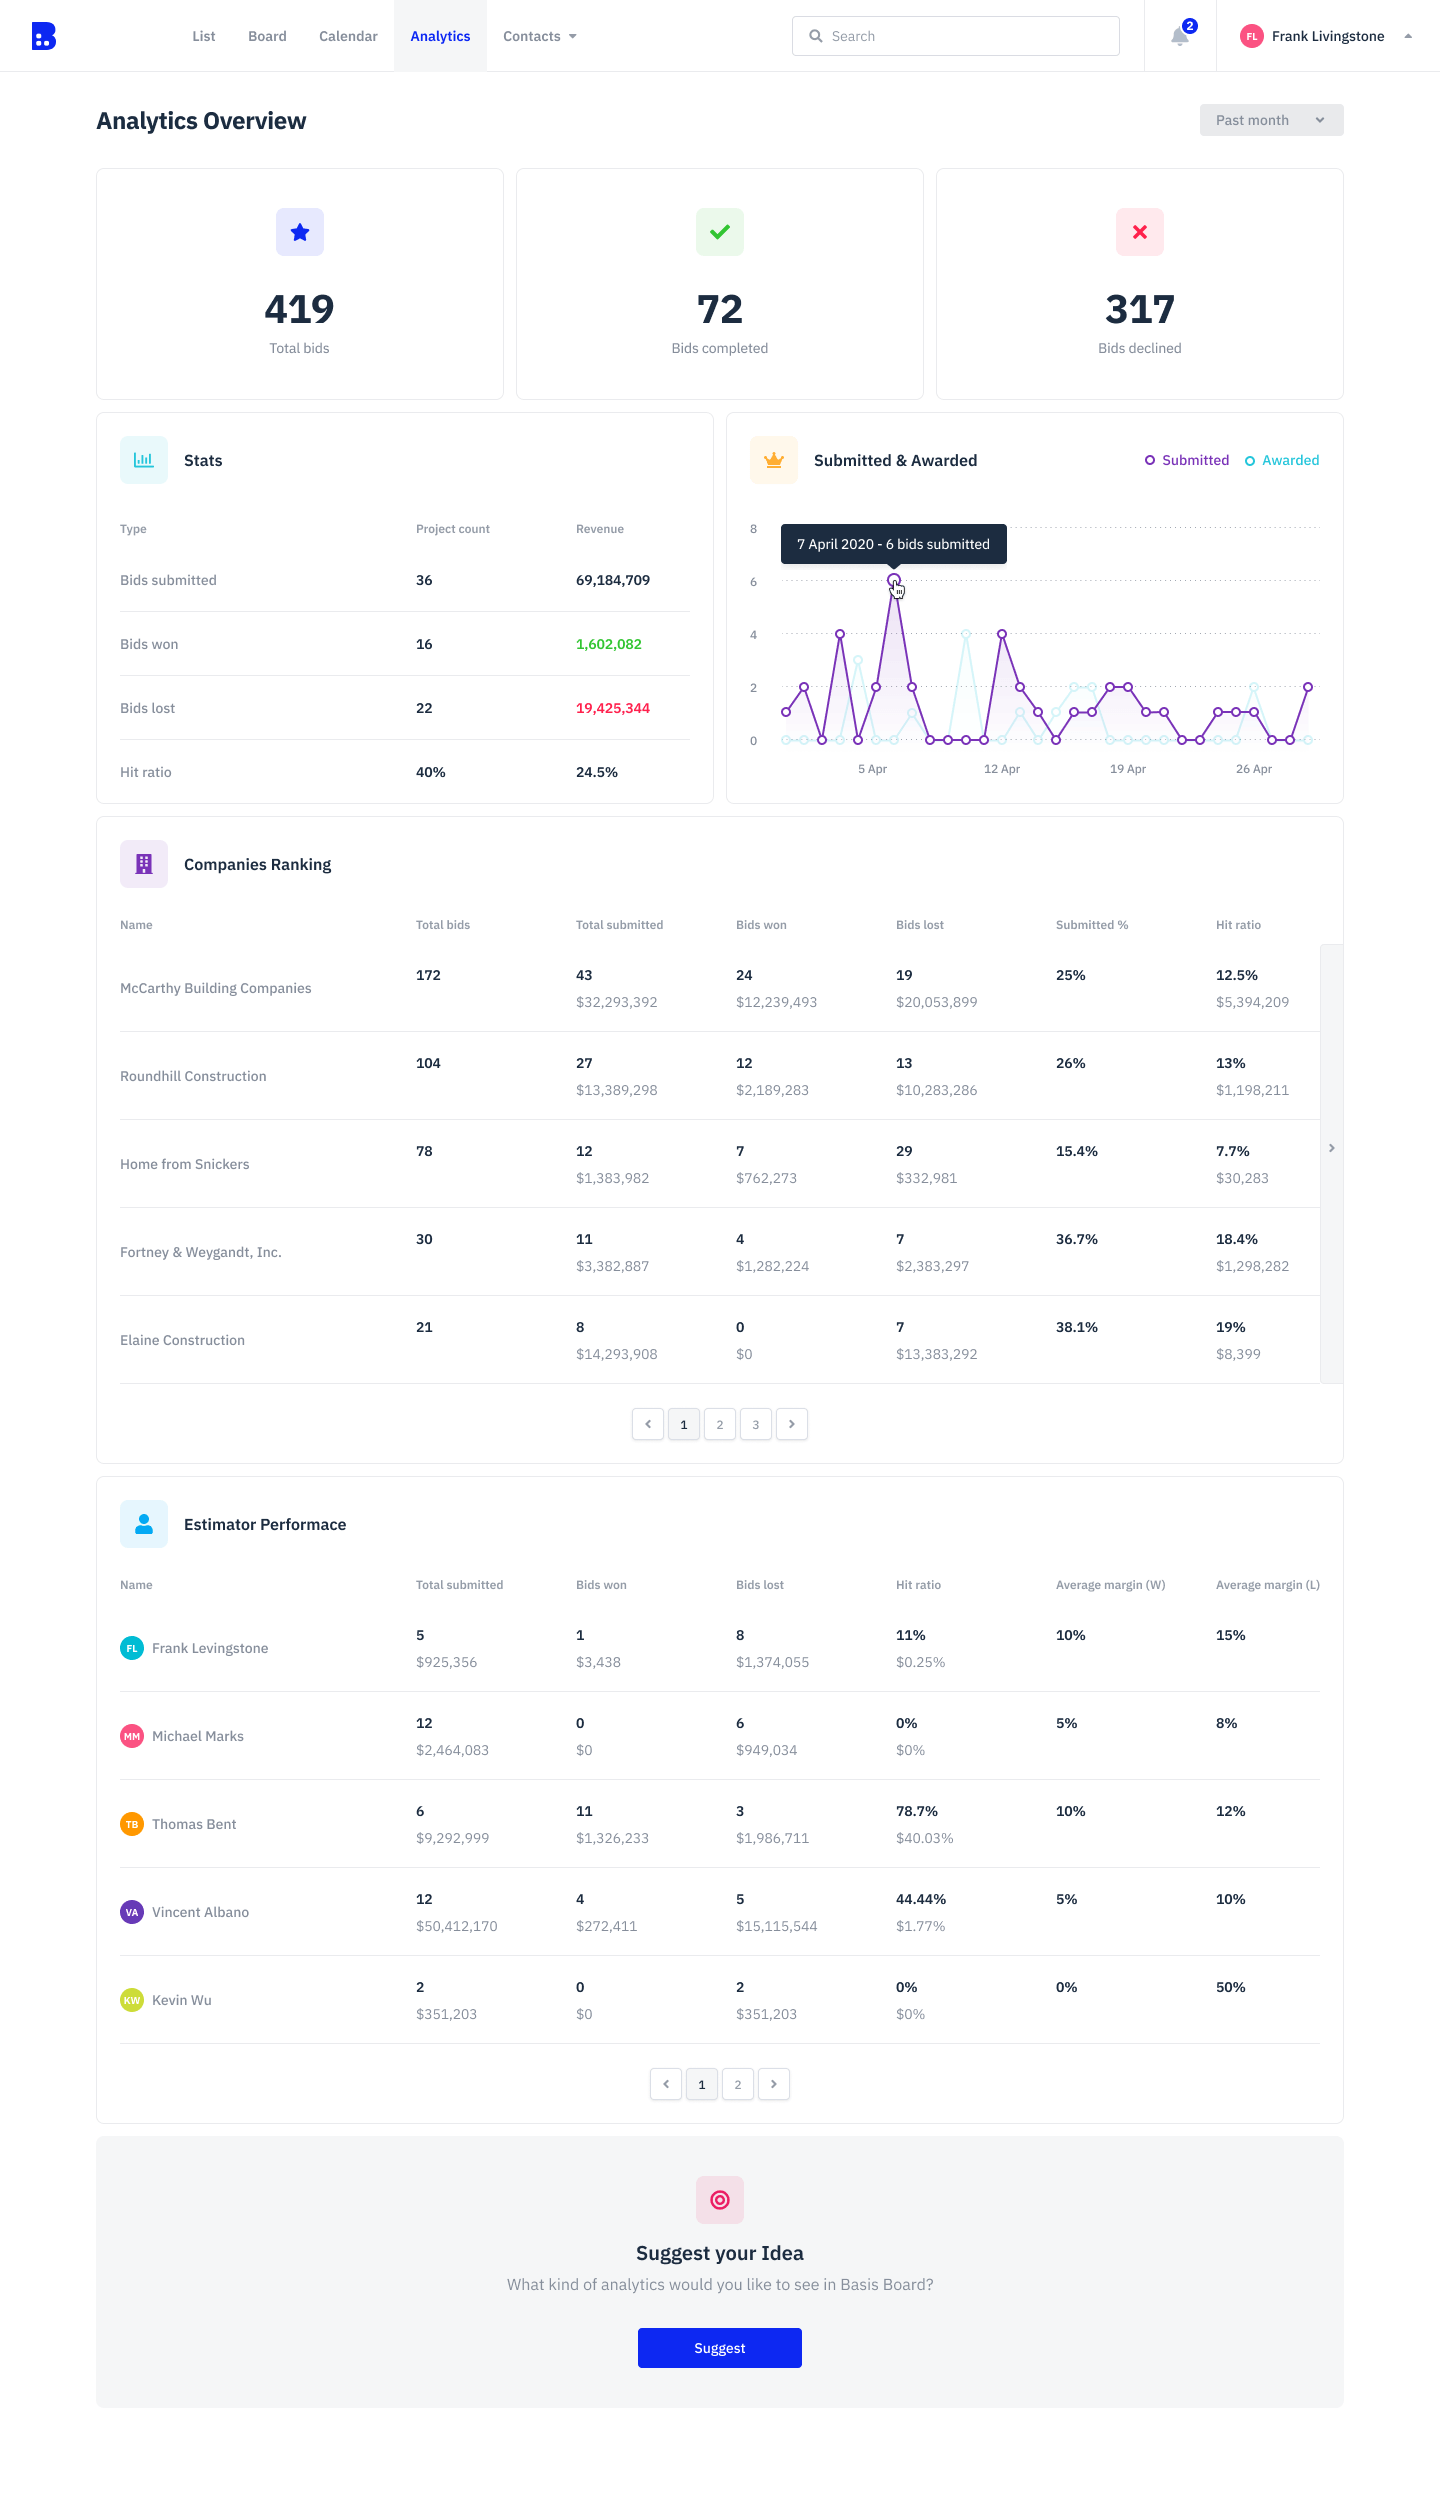 Example of analytics report in basis
Insight 2: Growth = Accurate hit-ratios
To hit ambitious, long-term growth goals, requires estimating teams to be disciplined about hit-ratios. The key is not to necessarily have high hit-ratios, but rather to have an accurate understanding of what hit-ratio looks like for your various market-verticals, GCs and niches. This enables you to be strategic about the markets that you're going after to hit revenue goals and just how much of a volume bidder you need to be.
For example, consider a subcontractor that is trying to achieve 100m in revenue, where the projects range from 25 million to 1 million. By having a clear and precise understanding of hit-ratio in various niches, we can forecast a path towards 100 million and also perform a quick eye-test to see if the growth plan is plausible.
Path to 100 million
No growth plan is perfect, but the point of the exercise is to make a strategic bet on a realistic growth plan using data from past bids. In particular, trade contractors can then ask
- Are my current niches enough to reach my revenue goals?
- Are there enough projects in my market to hit my revenue goals?
- What other market sectors and niches should I expand into?
- What do my hit-ratios need to be in new market sectors to hit revenue goals?
Answering these questions faithfully using accurate data, then enables chief estimators and estimating teams to forecast and ask actionable questions around growth and hiring.
- Do we need to invest in hiring more estimators?
- Do we need to invest in hiring business development positions?
- Do we need to expand our market to other geographies?
Conclusion
What's surprising is how often we hear the phrases
- "We work with a core set of GCs so we don't need to analyze our bidding history"
- "We're a small shop so analyzing our numbers isn't really a necessity"
Yet, among our customers who are either in hyper-growth (grew more than 3x in the last 5 years) or market-leaders (i.e. gross over 100m+ in revenue), we never hear these words. They constantly request more precise reporting and visualizations in our analytics products. In fact, the CEOs and preconstruction directors say the same thing — that their success stems from being disciplined about bidding data to drive growth-related metrics like hit-ratio.